DIY Spotify Wrapped 🎧
Inspiration ✨
Modeling after selected dashboards from Spotify Wrapped 2022, I was able to use Tableau to recreate the year-end storyboard that Spotify provides to the user towards the end of the year. The data is extracted via Spotify Web API using the code which can be found in my github. You can try it yourself, too! There are step-by-step instructions and the Tableau template is already there for you to connect the cleaned data file!
With the ability to get my own data whenever I want, I can generate the wrapped any time of the year without having to wait for Spoty to create one for me at the end of the year. Moreover, Spotify Web API lets you choose the time range for your data: within the last 4 weeks ('short term'), 6 months ('medium term') or over several years including all new data as it becomes available ('long term'). The code I use for the storyboard is for the data within the last 6 months.
Spotify User Storyboard
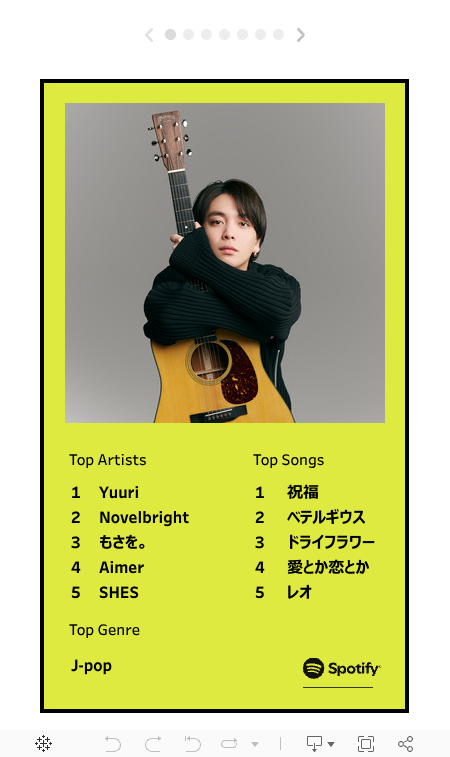
Data last updated: 4-Jun-2023
Limitations 😢
There are some limitations to the Tableau Public edition (Free!) in terms of getting all the images related to the data to display with the text data (this is not a limitation for Tableau Server edition). As a workaround, I configured the 'My Top Songs' and 'My Top Artists' dashboards to change the image according to which row of data is clicked on (try it out!).
Additionally, Spotify Web API does not include an endpoint where you can get 'minutes listened' on your top songs data. Hence, such information is omitted from the 1st dashbaord.
User Storyboard with my Own Twist🌪️
Here's my own version of Spotify Wrapped storyboard that is more interactive and utilize more of the data found in the Spotify Web API! Be sure to follow the prompt on the dashboard and click around👆
📝Note: If any preview of the song does not work, that means Spotify's preview page URL for that song does not exist.
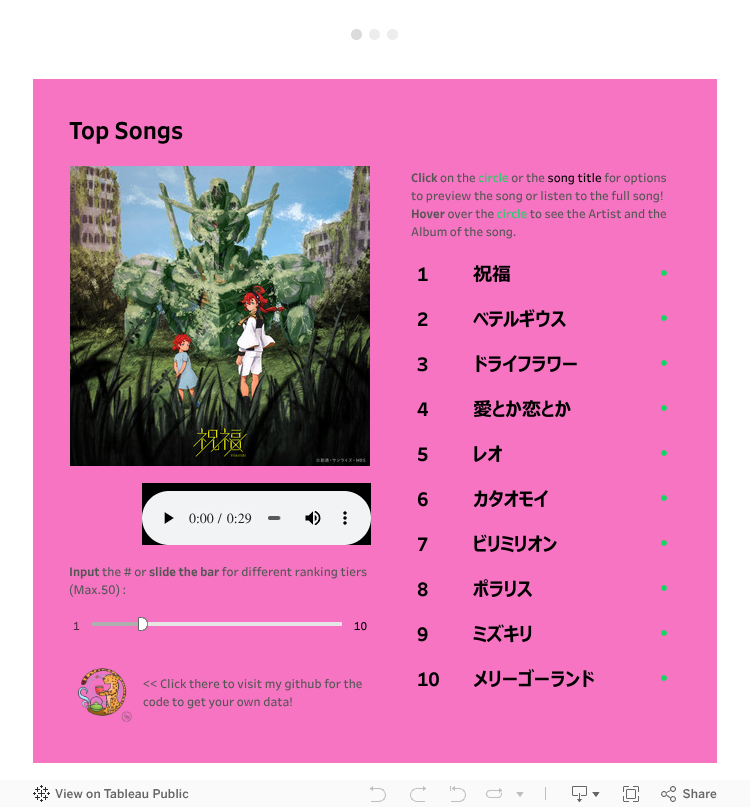
Data last updated: 4-Jun-2023
OG Tableau Project
Click here to go to the project on my Tableau Public profile👉 Spotify-Wrapped